More ways of starting on legacy code
This week I wanted to explore more alternative ways of approach a new code base; be it Perl or any other programming language.
Online tools
If you are using a tool like GitHub, you have some tools at your disposal already. In the earlier posts, the screen shots of code I shared were from GitHub, I just zoomed out in the browser. I find the Contributors info in "Insights" really useful. You can see who wrote much of the code, then look at the commits to get a feel for where the churn is.
As a Perl person, you might like to take a look at Kritika.io as an example of the value of good tools. It unlike many has strong Perl support, such as Perl::Critic (more on that shortly), along with giving school style "grades" on specific files (A, B , B-, etc). It also tells you about churn, complexity and lines of code.
One of the interesting parts of Kritika (and similar tools) is the diagrammatic depictions of your code base, such as this one:
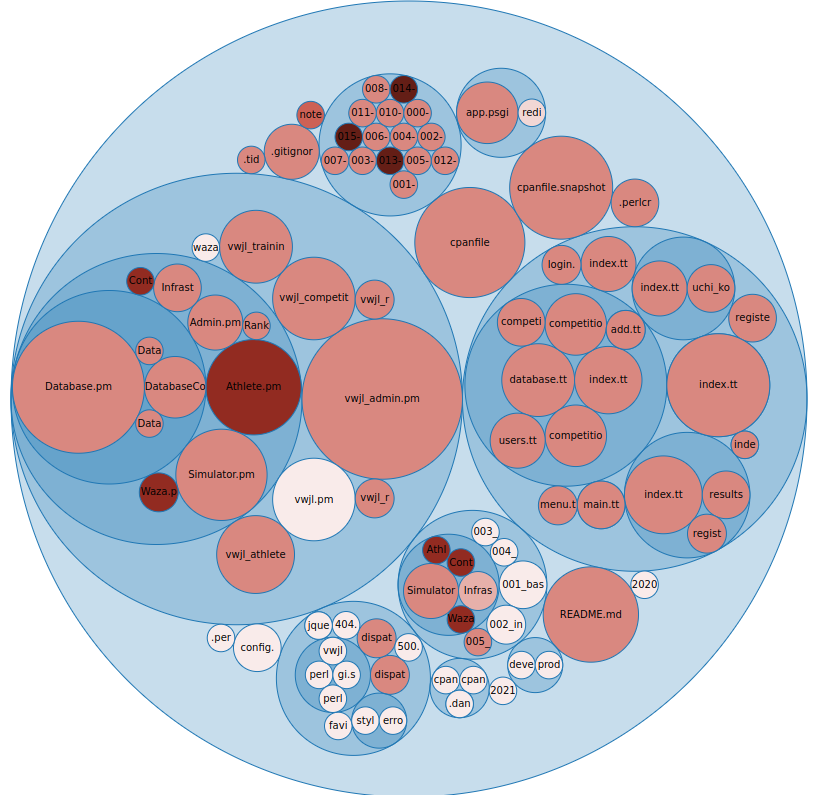
This gives a perspective on change "frequency over X time", in this case you can see the larger files have changed more frequently and the darker ones are more recently changed. This can give some insights into areas that are frequently changed (often problem areas) and so forth. A large frequently changed file for example might be one to consider breaking up.
Local tools
Kritika, is an interesting tool that prings us to Perl::Critic a staple of Perl development and a really great tool that is undervalued sometimes. It's incredibly extensible, so can do far more than what it does "out of the box". I'd strongly recommend running it on any new code base to help identify known "code smells".
Along with identifying code smells, it's very good at giving you some statistics on your code base, via the --statistics command, for example:
$ carton exec 'perlcritic --statistics-only lib'
   19 files.
   33 subroutines/methods.
1,153 statements.

1,670 lines, consisting of:
      316 blank lines.
        3 comment lines.
        0 data lines.
    1,351 lines of Perl code.
        0 lines of POD.

Average McCabe score of subroutines was 2.33.

2 violations.
Violations per file was 0.105.
Violations per statement was 0.002.
Violations per line of code was 0.001.

2 severity 4 violations.

2 violations of Subroutines::RequireFinalReturn.
So in this (not terrible) example; we can see that the complexity score of subroutines is 2.33, we have some statistics there about violations per file, statements and lines of code.
We also can make some measures of subroutines to files rations etc.
Another interesting way of looking at your new code base is gource
In the video above, you can see how developers have worked on the code base and see hot-spots and trends.
Another interesting tool, that may help with a legacy Perl code base is Code::Statistics. Once installed, you can run with codestat collect which will collect statistics on your code base. After which you run codestat report which will give you something like this:
================================================================================
                                  RootDocument
================================================================================

averages
ccomp: 19.5462060820785
lines: 438.453793917921
sdepth: 0
size: 12888.2081488043


                                     ccomp
top ten
Path                                  Line Col Ccomp Lines Sdepth Size    Dev.
--------------------------------------------------------------------------------
/SQL/Translator/Parser/DB2/Grammar.pm    1   1  6419 47955      0 2484388 328.40
ocal/lib/perl5/Perl/Tidy/Formatter.pm    1   1  3389 20274      0  782689 173.38
ocal/lib/perl5/Perl/Tidy/Tokenizer.pm    1   1  1193  8885      0  322357  61.03
/local/lib/perl5/Module/Build/Base.pm    1   1  1108  5568      0  161767  56.69
vwjl/local/lib/perl5/IO/Socket/SSL.pm    1   1   984  3509      0  109767  50.34
ib/perl5/Perl/Tidy/VerticalAligner.pm    1   1   681  4892      0  183931  34.84
l/local/lib/perl5/Parse/RecDescent.pm    1   1   592  6610      0  221223  30.29
cal/lib/perl5/DBIx/Class/ResultSet.pm    1   1   587  4824      0  143831  30.03
dev/vwjl/local/lib/perl5/Perl/Tidy.pm    1   1   572  4140      0  156109  29.26
ancew/dev/vwjl/local/lib/perl5/MCE.pm    1   1   562  2106      0   67048  28.75
--------------------------------------------------------------------------------

bottom ten
Path                                  Line Col Ccomp Lines Sdepth Size    Dev.
--------------------------------------------------------------------------------
e/lancew/dev/vwjl/lib/VWJL/Contest.pm    1   1     1    15      0     151   0.05
w/dev/vwjl/lib/VWJL/Infrastructure.pm    1   1     1    12      0     252   0.05
WJL/Infrastructure/DatabaseResults.pm    1   1     1    29      0     541   0.05
home/lancew/dev/vwjl/lib/VWJL/Waza.pm    1   1     1    27      0     251   0.05
/lancew/dev/vwjl/lib/vwjl_redirect.pm    1   1     1     8      0      99   0.05
ome/lancew/dev/vwjl/local/bin/plackup    1   1     1   236      0    7444   0.05
cal/lib/perl5/App/Cmd/ArgProcessor.pm    1   1     1    51      0     934   0.05
/lib/perl5/App/Cmd/Command/version.pm    1   1     1    68      0    1255   0.05
wjl/local/lib/perl5/App/Cmd/Plugin.pm    1   1     1    43      0     688   0.05
hare/dist/Dancer2/skel/lib/AppFile.pm    1   1     1    10      0     151   0.05
--------------------------------------------------------------------------------
And much much more.
Run the tests!
This is probably one of the key approaches, run the tests. Understand the tests.
Then write more tests.
No tech solution
Draw it; never underestimate the power of drawing a diagram that shows the connections between classes.
Start with whatever you find easiest (say the homepage if a web app), and work through all the connections. Mapping out perhaps what the data provide to the template is, what does that connect to? What methods are called? What data is passed around.
This might help you identify the code that is "business logic", what is "infrastructure" etc. Where are the linkages? What files have too much code in them? Is there a clear flow to the code?
Visualising it can be super powerful, even if like me you are not particularly artistic.